
Platform · Steer & anticipate
Analytics and reports: your activity becomes readable
See. Understand. Decide.
Every request executed in Nereva leaves a trace: site, client, truck, time-stamped steps, photos and delivery notes. The statistics, the statements and the history in the back office make them readable, with no re-entry: indicators per period, comparisons and documents generated from the missions. On the transport side and on the construction side.
15-day free trial with 2 licences. No payment method required.
What operations produce
See. Understand. Decide.
No report to build, no spreadsheet to maintain: the figures, the comparisons and the documents come from the executed requests.
See what happened
The back office statistics show, for the chosen period, what the activity produced: revenue, estimated margin, requests and time on mission on the transport side; spending, requests and costs on the construction side.
The statisticsUnderstand the gaps
Every indicator is compared with the previous period; a truck is compared with the fleet, a site with the other sites, a request type with the other types. Enough to spot the gaps and better understand the costs.
The comparisonsDecide with indications
The figures give indications for deciding: assigning a truck, reviewing how a site is organised, discussing a cost. Judgement stays with your teams; the statements, the reports and the history provide the evidence.
Data and decision
Analysing a truck, a period, subcontracting
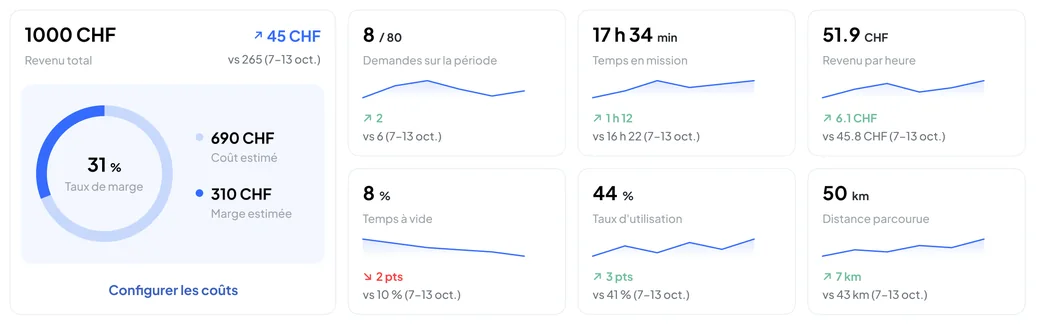
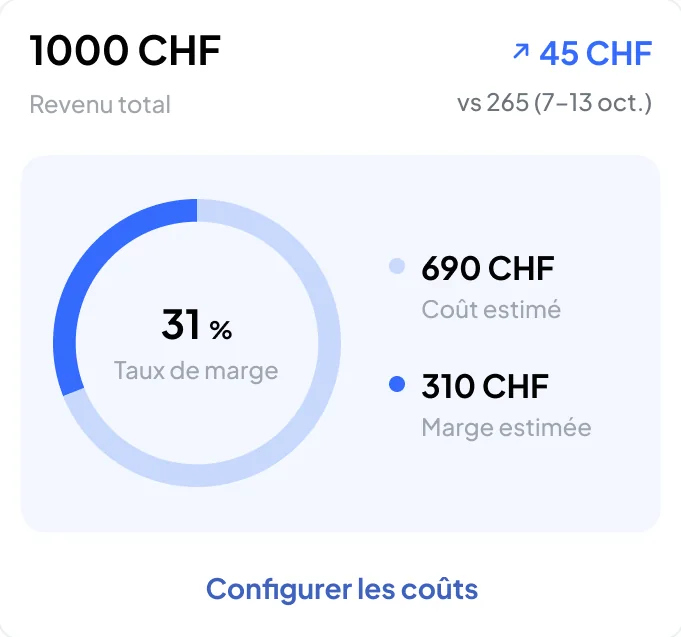
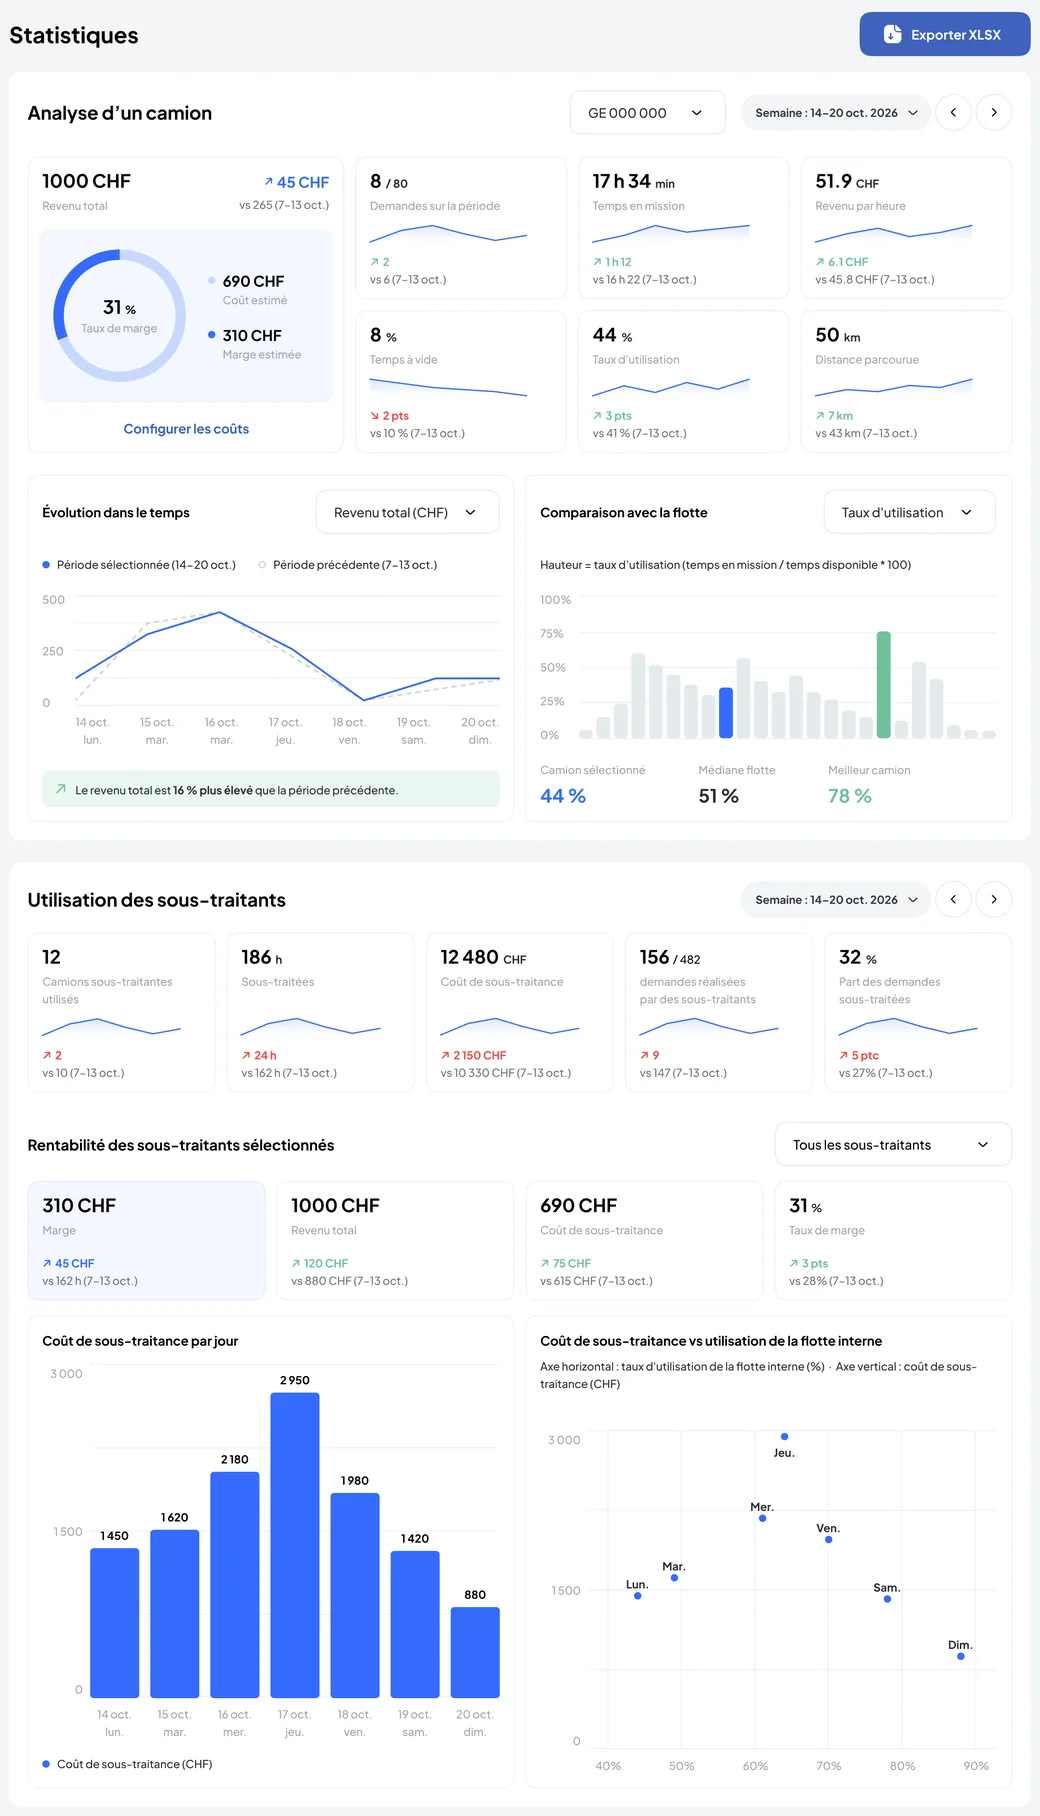
The Statistics module of the Transport back office analyses one truck over the chosen period: total revenue, estimated cost and margin, requests carried out, time on mission, revenue per hour, idle time, utilisation rate and distance travelled, each indicator compared with the previous period.
- Trend and comparison. The trend over time against the previous period, and the comparison of the truck with the fleet: selected truck, fleet median, best truck.
- Subcontracting. Subcontractor trucks used, subcontracted hours, subcontracting cost, share of subcontracted requests, then the profitability of the selected subcontractors, day by day and against the use of the in-house fleet.
- Export and dashboard. The statistics export as XLSX. The dashboard keeps the fleet counters, the skips on sites, the kilometres travelled and the live map.
Estimated costs are based on the costs you configure. You use these figures on your own, even if your clients are not on Nereva yet: they come from your own operations.


Steering spending, site by site
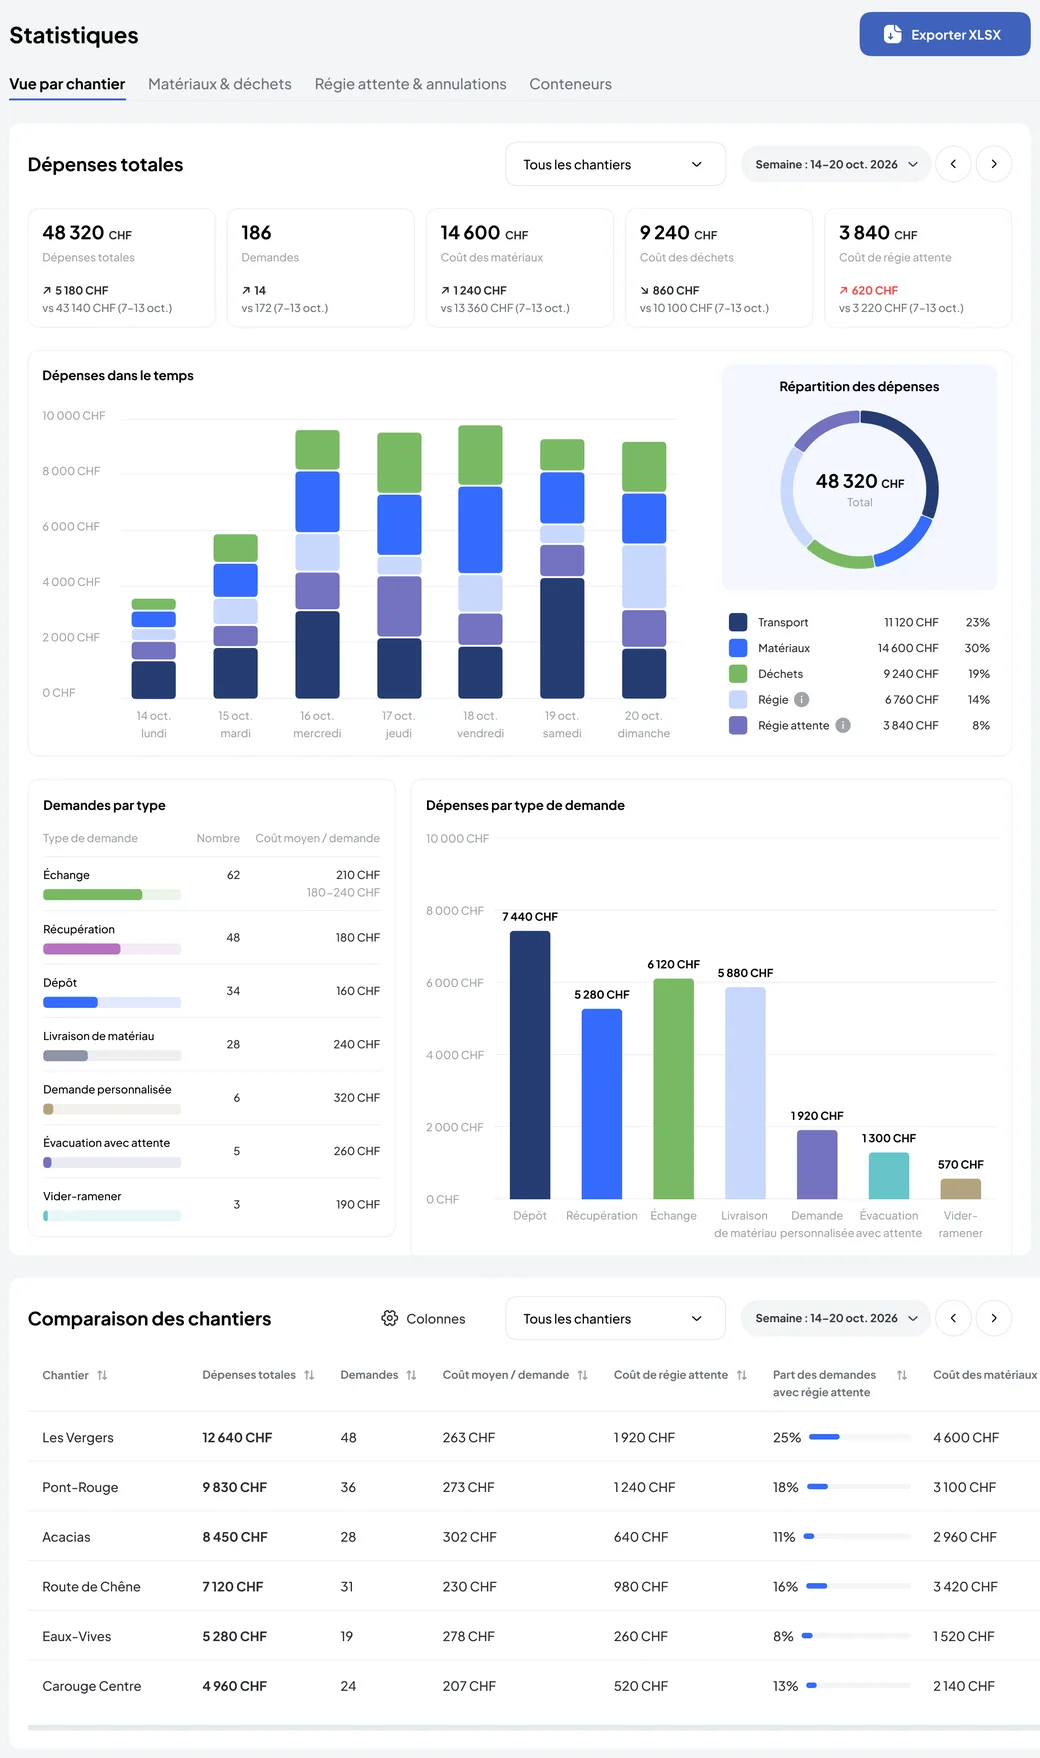
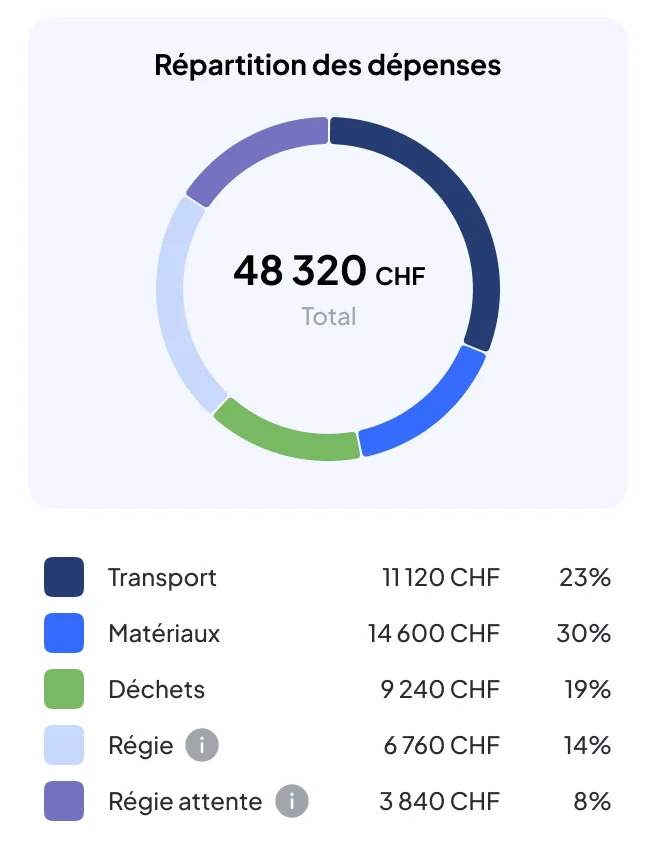
The Statistics module of the Construction back office gives, for the chosen period and for one site or all of them, total spending, the number of requests, the cost of materials, the cost of waste and the cost of waiting time, each compared with the previous period.
- Over time and by item. Spending day by day, split between transport, materials, waste, time and materials and waiting time, and its breakdown over the period.
- By request type. The number of requests and the average cost per request for each type: exchange, collection, drop-off, materials delivery, custom request, removal with waiting, empty-and-return.
- Between sites. A table compares the sites: total spending, requests, average cost per request, cost of waiting time, share of requests with waiting time, cost of materials.
What you follow are your requests and their execution by your partner carriers; your carriers’ statements arrive in the back office, attached to the services. The fleet itself remains steered by the carrier.


The skip stock by status, the fleet on the map
The skip stock is read by type and by status: at the depot, on site, on a truck or in maintenance, with the history of movements. Individual identification of each skip is in development.
The trucks’ position comes from the driver app, during the mission. The fleet map, the sites and the depots are on the dashboard; the details are on the Truck GPS and Fleet tracking pages.

Documents generated from the missions
In the Invoices module of the Transport back office, daily and monthly statements are generated per client and per site from the executed missions: reference, date, request, truck, skip, destination, distance, price, linked photos and receipts. You check them, then send them to your client, as PDF or XLSX.

A report per truck gathers, for the month, the missions of one vehicle; prices can be included in the download or left out. On the construction side, your carriers’ statements arrive in your back office, attached to the services.

Every request keeps its thread
Creation, carrier, driver, time-stamped steps, photos, delivery notes, amounts: the thread of a request is found per site, per client and per truck. It is the raw material of the figures and the documents.
It is also what the QHSE manager finds in case of an inspection: operations produce the data, QHSE can then use it.

Data and decision
Indications, not verdicts
Judgement stays with the teams
Nereva’s analytics functions produce indications of a purely indicative nature: they inform your teams’ judgement, they do not replace it. No automated decision is taken about people, and geolocation is never used to monitor, rank or sanction a driver.
Your data belongs to you
It is hosted in Switzerland, it remains yours and you can export it at any time. Statements and reports download as PDF or XLSX.
Data hostingWhat comes next
Forecasts and tensions belong to EVA, our anticipation engine, which is in development. We publish no dates.
Forecasts & tensionsYour questions
Analytics, in plain terms
Where do I see the kilometres travelled?
In the Transport back office dashboard, with the skips on sites and the skips dropped at the sorting centre, and in the statistics per truck (distance travelled over the period). The route mileage is calculated before departure and the distance travelled is recorded for every mission; it also appears in the statements.
Can statistics, statements and reports be exported?
Yes. Statistics export as XLSX from the Statistics module. Daily and monthly statements and reports per truck download as PDF or XLSX from the Invoices module and are sent to the client. More broadly, your data belongs to you and remains exportable at any time.
Which statistics for a transport company?
Per truck and per period: total revenue, estimated cost and margin, requests, time on mission, revenue per hour, idle time, utilisation rate, distance travelled, trend over time and comparison with the fleet; then the use and profitability of subcontractors. Estimated costs are based on the costs you configure.
What does a construction company see?
Its open sites, its transport spending, its skips being loaded, the map of its sites, its closed requests and the cost of each site; in the Statistics module, the period’s spending by item, by request type and by site, compared with the previous period; then, per site, the history and its carriers’ statements.
Are the indicators real-time?
The fleet map is live. The dashboard counters are read when the back office opens; the statistics are calculated over the chosen period and compared with the previous period; statements are generated per day or per month. Nereva shows no forecasts: anticipation belongs to EVA, in development.
Do the statistics guarantee a gain?
No. They make the activity more readable and help spot gaps and losses of efficiency; the decisions, and their results, remain those of your teams. Nereva promises no financial gain.
Do the figures replace the teams’ judgement?
No. The analytics functions produce indications of a purely indicative nature: they inform your teams’ judgement, and your teams always have the last word.
Other questions? See the general FAQ.
Go furtherYour operating statistics: see, understand, decide.
15-day free trial with 2 licences. No payment method required. Then a monthly subscription, with no fixed term.