Interested in working together?
Contact us →In this article
An overview of spending, site by site
On a construction site, money leaves in small amounts: a skip exchanged, a removal, a delivery of materials, an hour of waiting time because the truck had to wait. Taken one by one, these amounts go unnoticed. Added up over a week or a month, they weigh on the site’s margin. The Statistics module of the Construction back office brings them together in one place.
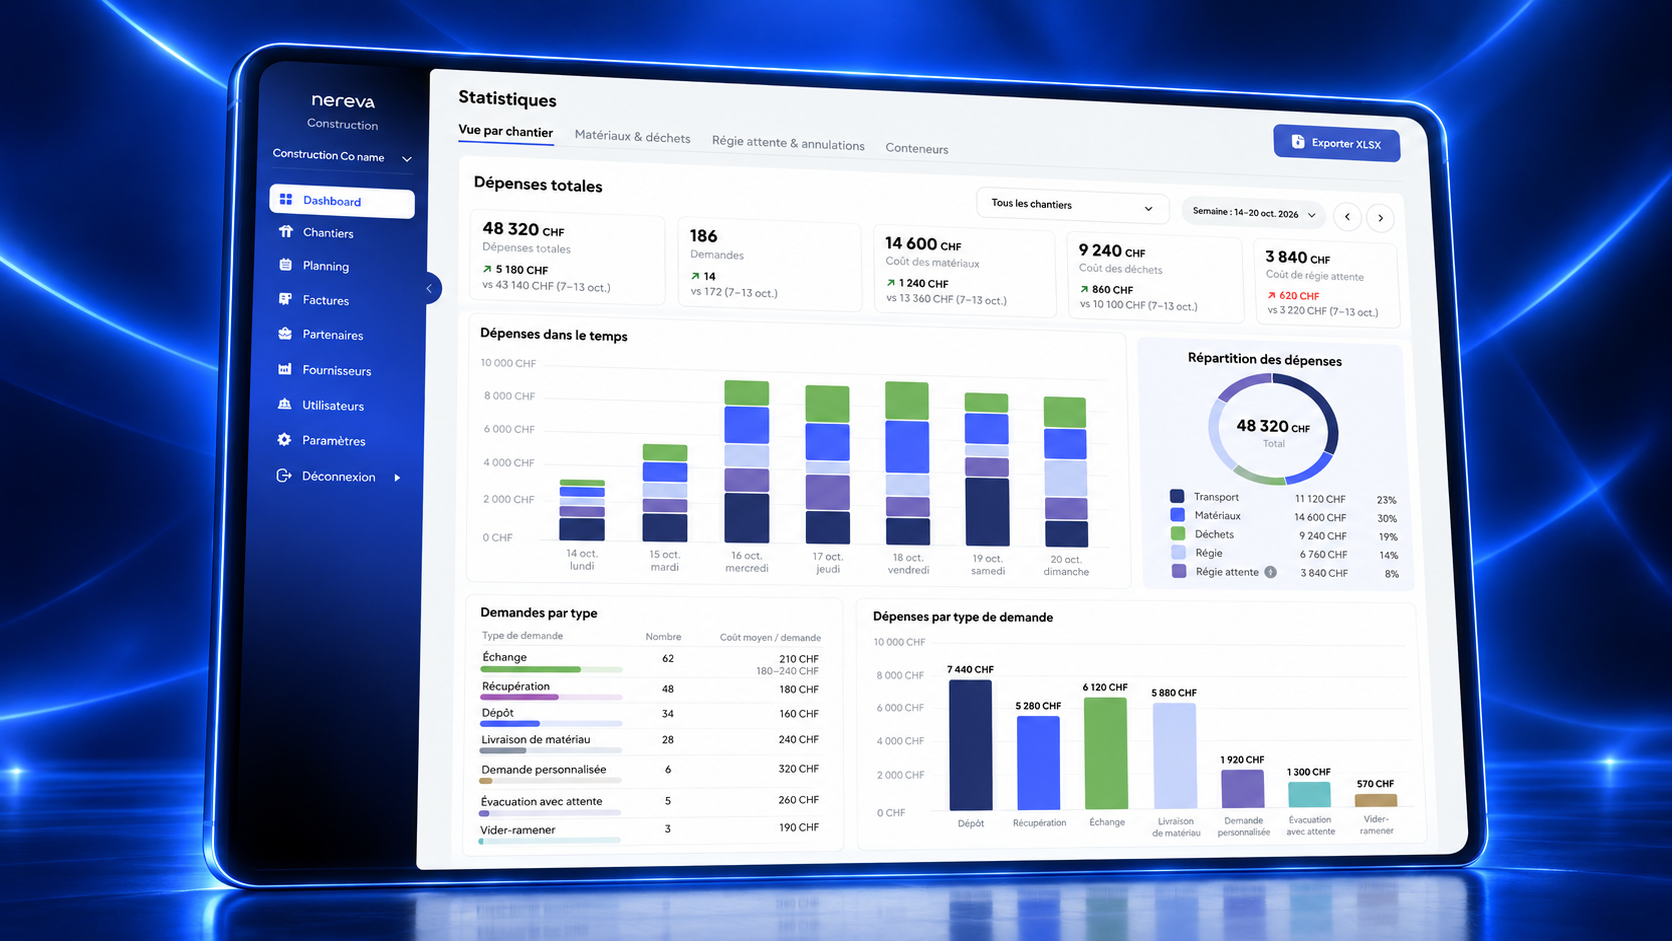
For the chosen period, and for one site or for all sites, it shows total spending, the number of requests, the cost of materials, the cost of waste and the cost of waiting time. Each indicator is set against the previous period, so that what is rising and what is falling can be seen at once. Tabs separate the view by site, materials and waste, waiting time and cancellations, and containers.
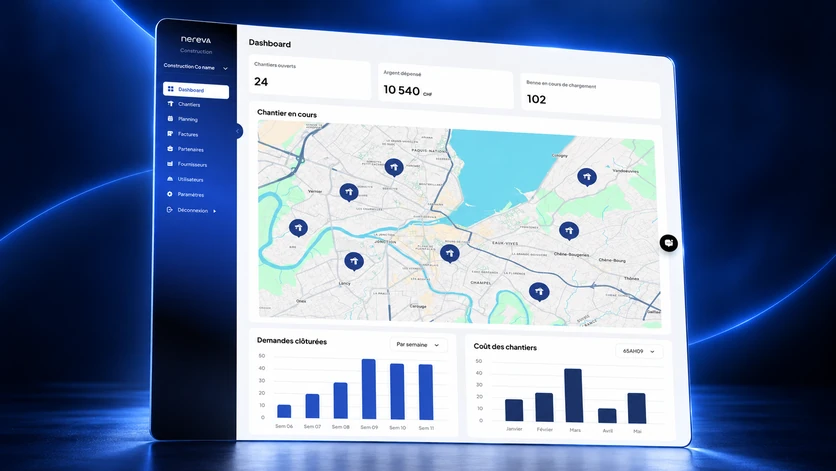
The screen shown at the top of this article is a demonstration screen: the amounts displayed are not clients’ results.
Figures that come from requests, not from data entry
Nereva’s principle does not change with statistics: operations produce the data. Every request created by the site in Nereva Commandes or in the back office, then executed by the connected partner carrier, keeps its thread: site, request type, carrier, driver, time-stamped steps, photos, delivery notes and amounts. The carriers’ statements arrive in the back office, attached to the services.
The statistics are built on this material. Nobody re-enters a delivery note in a spreadsheet on Friday evening, and nobody needs to ask the carrier for a statement of spending: the figures exist as soon as the requests are executed and closed.
Materials, waste, transport: where the money goes
Spending can be read over time, day by day, split between transport, materials, waste, time and materials, and waiting time. A second chart gives the breakdown of these items over the period. The site manager can thus see whether a heavy week comes from a large delivery of materials, from a series of removals or from waiting hours that add up.
For waste, the same data serves twice. It feeds the cost of waste in the statistics, and it remains available in the request history for the QSE manager: waste types, weights, drop-off times at the sorting centre, photos. Operations produce the data; QSE can then use it.
Analysing by request type
Not all requests carry the same weight. The module counts requests by type and calculates the average cost of each: exchange, collection, drop-off, materials delivery, custom request, removal with waiting, empty-and-return. A chart sets spending by request type side by side over the period.
This reading gives concrete indications. An average exchange cost drifting on one site, a growing share of removals with waiting, more custom requests than elsewhere: so many signals to discuss with the site foreman or with the carrier, figures in hand.
Comparing periods and sites
Each indicator is compared with the previous period, and the period is chosen in a few clicks. This is what makes it possible to follow a site over time: the spending of an earthworks week does not look like that of a finishing-works week, and that is normal. What matters is to see it, and to be able to explain it.
Between sites, a table compares total spending, the number of requests, the average cost per request, the cost of waiting time, the share of requests with waiting time and the cost of materials. Management can thus spot the site that consumes more than the others, and the site manager can situate his own. The statistics export as XLSX to be reworked or passed on.
For the site manager and for management
The site manager finds there the follow-up of his sites: what was ordered, what was executed, what it cost, and the gaps that deserve an explanation. Management finds a consolidated view of all sites, without waiting for the end of the month or for the accounting consolidation.
These indicators are indications, not verdicts: they inform the teams’ judgement, they do not replace it. Decisions, assigning a request, reorganising a site, discussing a cost with a carrier, remain the company’s. The data is hosted in Switzerland, it remains the company’s property and can be exported at any time.
The Construction back office works with the company’s connected partner carriers: Nereva provides neither truck, nor driver, nor skip, and the fleet remains steered by the carrier. What the construction company follows are its requests, their execution and their cost.
Keen to see Nereva on your own flows?
Try free for 15 days →