Interested in working together?
Contact us →In this article
Analysing one truck over the chosen period
A truck that is on the road is not necessarily a truck that pays. Between rotations, waiting on site, empty kilometres and missions handed to a subcontractor, a vehicle’s result is hard to read in a schedule. The Statistics module of the Transport back office makes it readable, truck by truck.
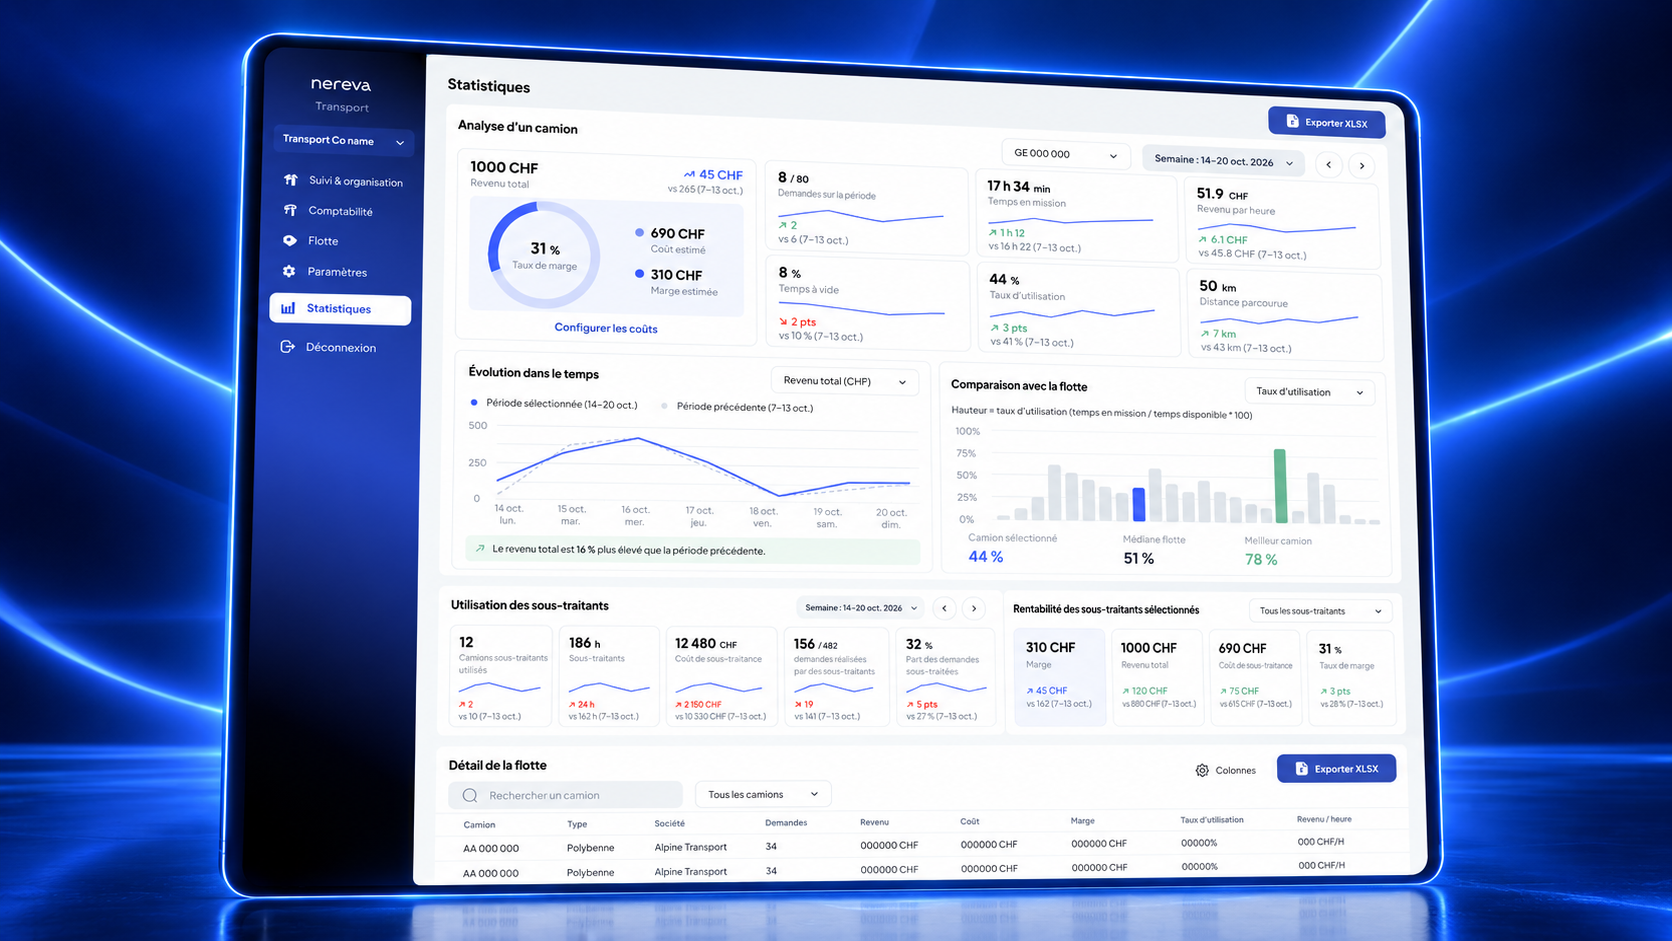
The operations manager chooses a truck and a period, a week for instance. The module shows total revenue, estimated cost and margin, requests carried out, time on mission, revenue per hour, idle time, utilisation rate and distance travelled. Each indicator is set against the previous period.
The screen shown at the top of this article is a demonstration screen: the amounts displayed are not clients’ results.
Estimated costs and margins, from your own costs
Revenue comes from the executed missions and their prices. The estimated cost, for its part, is based on the costs the company configures in the back office for its vehicles. The estimated margin and the margin rate follow from it. These are operating estimates, useful for day-to-day decisions, not cost accounting: the accounting result stays in the company’s software.
This logic has one advantage: the figures reflect the company itself. A carrier whose real costs change updates its configuration, and the estimated margin follows.
Time on mission, hourly revenue, idle time, utilisation rate
These four indicators describe the same reality from different angles. Time on mission measures what the truck actually did over the period; revenue per hour relates revenue to that time; idle time flags journeys without a load; the utilisation rate relates time on mission to available time.
Taken together, they give concrete indications for operations: a well-used truck with low hourly revenue raises the question of prices or distances; a profitable but little-used truck raises that of the schedule. Decisions remain the dispatcher’s and management’s; the module gives them what they need to take them.
These indicators concern vehicles and operations. In line with Nereva’s commitments, geolocation is never used to monitor, rank or sanction a driver.
Comparing a truck with the fleet
The trend over time sets the chosen period against the previous period, for the selected indicator. The comparison with the fleet places the selected truck against the fleet median and the best truck, on the utilisation rate for example.
The fleet details then bring all trucks together in a table: type, company, requests, revenue, cost, margin, utilisation rate, revenue per hour. The whole exports as XLSX. The dashboard, for its part, keeps the fleet counters, the skips on sites, the kilometres travelled and the live map.
Subcontracting, measured
Many construction carriers hand part of their requests to subcontractors, especially at peak times. The module follows this share: subcontractor trucks used, subcontracted hours, subcontracting cost, number and share of requests carried out by subcontractors.
The profitability of the selected subcontractors completes this follow-up: margin, total revenue, subcontracting cost and margin rate, against the use of the in-house fleet. Enough to answer, figures in hand, a question every operations manager asks: should we have subcontracted this week, or filled our own trucks better?
A standalone TMS, figures from operations
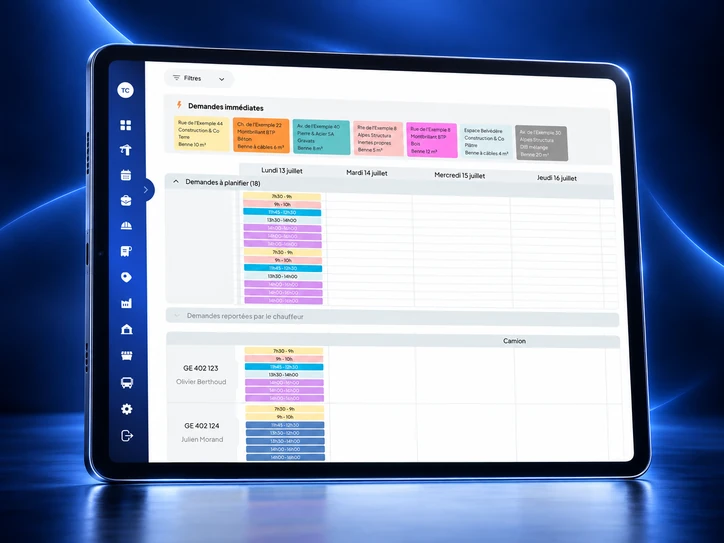
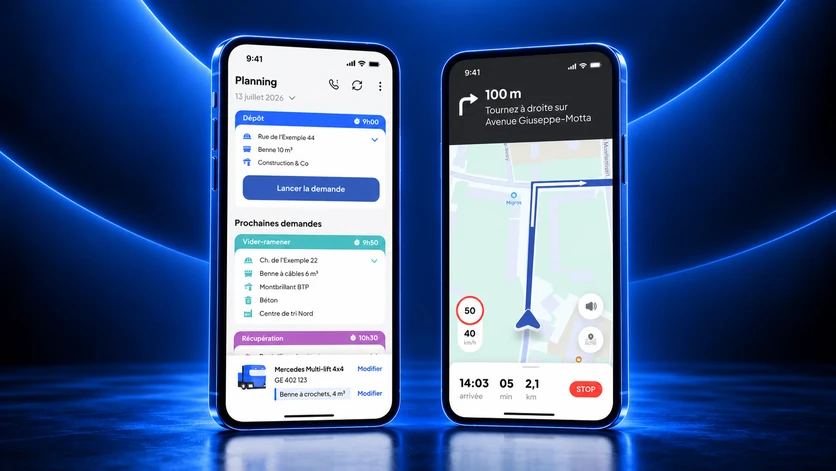
The Transport back office can be used on its own. A carrier whose clients are not on Nereva enters its requests, its drivers execute them in Nereva Transports, and the statistics are built on those missions. When construction clients are connected, their requests arrive directly in the schedule; the figures remain those of the carrier’s own operations.
No re-entry: the indicators come from the executed missions, time-stamped and documented by the drivers. The data is hosted in Switzerland, it remains the company’s property and can be exported at any time. The indications provided inform the teams’ judgement; they do not replace it.
Keen to see Nereva on your own flows?
Try free for 15 days →